Volvo Group 2024 Financial Analysis: Key Insights & Strategic Recommendations
- Aug 23, 2025
- 3 min read
Updated: Feb 4




In today's rapidly evolving automotive and commercial vehicle industry, understanding market dynamics and strategic positioning is crucial for investors, stakeholders, and industry professionals. This comprehensive analysis examines Volvo Group's 2024 financial performance, revealing critical insights into their market leadership, operational challenges, and strategic opportunities across their diversified business portfolio.
Executive Summary
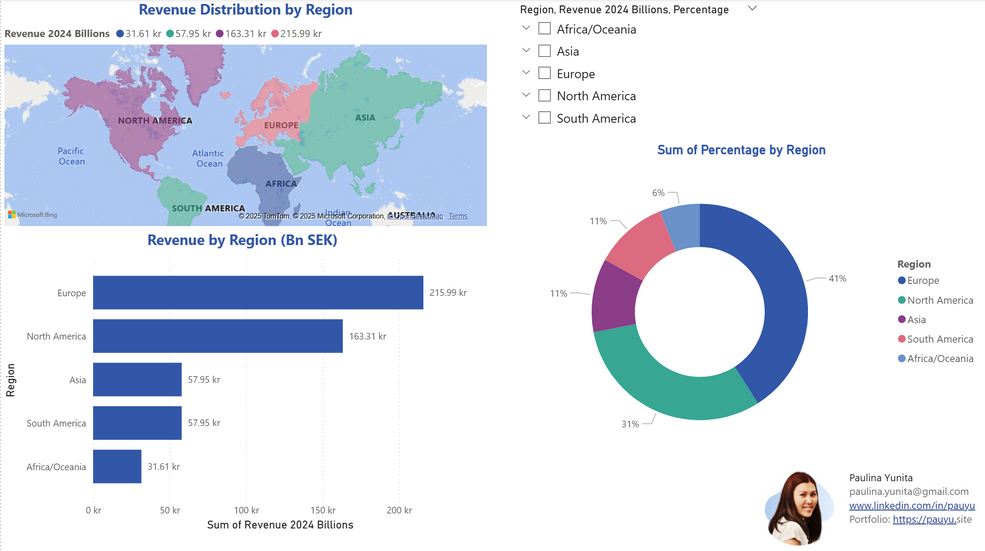
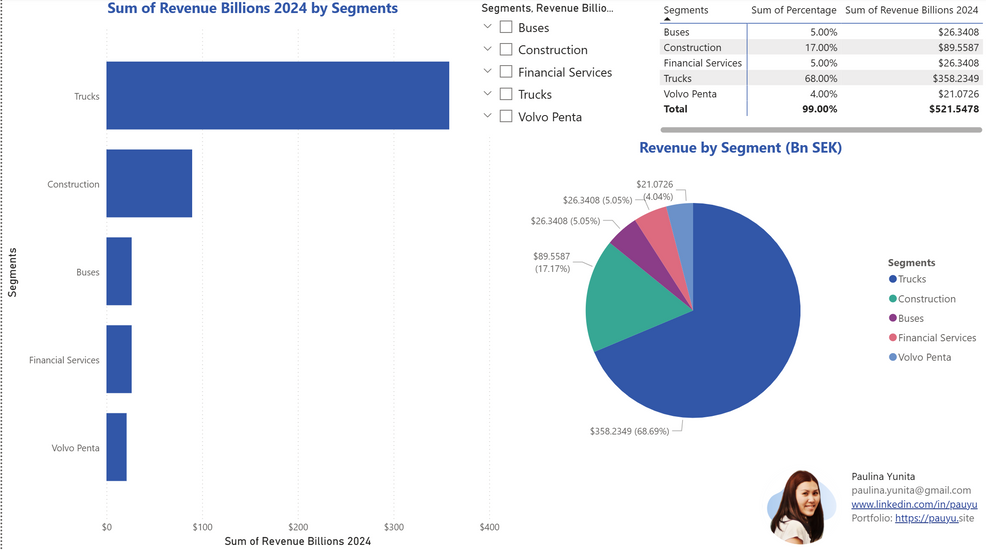
The company demonstrates robust global diversification with total revenue of SEK 526.8 billion in 2024, though facing a 4.6% year-over-year decline from 2023's SEK 552.3 billion. The organization maintains strong geographic spread across five major regions, with Europe leading at 41% market share (SEK 216.0 billion) and North America contributing 31% (SEK 163.3 billion). The business portfolio is strategically concentrated in the Trucks segment, which dominates with 68% of total revenue (SEK 358.2 billion), positioning the company as a clear leader in commercial vehicle manufacturing.
Despite revenue headwinds, the company maintains healthy operational efficiency with a 12.1% operating margin and strong cash generation capabilities. The quarterly analysis reveals accelerated challenges in Q4 2024, with net sales declining 6.5% to SEK 138.4 billion compared to Q4 2023, accompanied by a significant 24% drop in adjusted operating income. However, the diversified portfolio across Construction (17%), Financial Services (5%), Buses (5%), and Volvo Penta (4%) provides strategic resilience against market volatility.
Key Strategic Insights
• Market Leadership in Trucks: The 68% revenue concentration in Trucks (SEK 358.2 billion) establishes dominant market position, but creates dependency risk requiring diversification strategies
• Geographic Risk Distribution: Well-balanced global footprint with Europe (41%) and North America (31%) as primary markets, while emerging markets (Asia 11%, South America 11%, Africa/Oceania 6%) offer growth potential
• Operational Resilience: Maintained 12.1% operating margin despite 4.6% revenue decline demonstrates strong cost management and operational efficiency
• Financial Services Integration: 5% revenue from Financial Services (SEK 26.3 billion) provides recurring income streams and customer financing solutions, enhancing competitive positioning
• Construction Segment Strength: 17% revenue share (SEK 89.6 billion) in Construction equipment diversifies beyond traditional trucking, capturing infrastructure development opportunities
• Q4 Performance Concerns: Accelerated decline in Q4 2024 with 6.5% revenue drop and 24% operating income decrease signals potential market headwinds requiring immediate attention
• Cash Flow Stability: Operating cash flow of SEK 45.8 billion maintains strong liquidity position for strategic investments and market downturns
Competitive Analysis Dashboard
Revenue Performance Comparison
2024 Total Revenue: SEK 526.8 billion
2023 Total Revenue: SEK 552.3 billion
Year-over-Year Change: -4.6%
Q4 2024: SEK 138.4 billion (-6.5% vs Q4 2023)
Market Position by Segment
Trucks: 68% market dominance (SEK 358.2B)
Construction: 17% market share (SEK 89.6B)
Financial Services: 5% recurring revenue (SEK 26.3B)
Buses: 5% niche positioning (SEK 26.3B)
Volvo Penta: 4% specialty marine/industrial (SEK 21.1B)
Regional Growth Trends
Europe: Largest market at 41% (SEK 216.0B)
North America: Strong presence at 31% (SEK 163.3B)
Emerging Markets: Combined 28% offering expansion opportunities
Geographic Diversification Index: Well-balanced across five regions
Strategic Recommendations
1. Accelerate Electrification Strategy
With the trucks segment representing 68% of revenue, rapid transition to electric vehicles is critical for maintaining market leadership and meeting regulatory requirements.
Action: Increase R&D investment in battery technology, expand charging infrastructure partnerships, and accelerate electric truck production to capture the growing sustainable transport market.
2. Expand Asian Market Presence
Asia currently represents only 11% of revenue despite being the world's largest commercial vehicle market, indicating significant untapped potential.
Action: Establish strategic partnerships with local manufacturers, adapt products for regional preferences, and increase local production capacity to reduce costs and improve competitiveness.
3. Optimize Cost Structure and Operational Efficiency
With operating income declining 15.9% while maintaining stable margins, urgent focus on cost optimization and operational efficiency is needed.
Action: Implement AI-driven supply chain optimization, consolidate manufacturing facilities, and leverage economies of scale across segments to improve profitability and competitiveness.
Implementation Priority: These recommendations should be executed in parallel with a 18-24 month timeline, focusing on electrification as the primary driver while expanding market reach and optimizing operations to support sustainable growth.
Conclusion
Volvo Group's 2024 performance demonstrates both the strengths and challenges facing commercial vehicle manufacturers in today's dynamic market. While revenue pressures and Q4 concerns require immediate attention, the company's strong operational margins, diversified business model, and solid cash position provide a resilient foundation for strategic transformation. Success will depend on executing the recommended electrification strategy, expanding into high-growth Asian markets, and maintaining operational excellence amid industry headwinds. Stakeholders should monitor Q1 2025 results closely for signs of market stabilization and early returns on strategic initiatives.
---
Tools: Excel & Power BI
Source: Volvo Group Annual and Quarterly Financial Report 2023 & 2024


